MicroZed Chronicles: ZU Board, Zmod AWG, and PYNQ
- Adam Taylor

- May 15, 2024
- 5 min read
Updated: Jun 25
One of the tasks I have been meaning to accomplish since receiving the Avnet ZU1CG board is connecting the high-speed IO interface with the Digilent Zmod AWG. While the high-speed IO on the ZU1CG is not fully SYZYGY compliant, they can be compatible provided the VCCIO voltage is set correctly using jumper JP3, and the selected voltage aligns with that required by the SYZYGY card.
To test this design, I am going to use PYNQ to create sequences for transmission over the DAC. This way, we can generate waveforms that are not only the classic sine waves but also more interesting waveforms such as frequency sweeps. As we have seen before in Hackster projects, generating signals using Python is simple and straightforward.
One of the great advantages of using Digilent Zmod and Pmods is that along with the physical Zmod or Pmod itself, Digilent also provides the programmable logic driver, which makes including them within your design pretty straightforward. Since I wanted to use the Zmod AWG, I first needed to download the Digilent Vivado library and add it to the Vivado project I had created, which targeted the ZU1CG board.
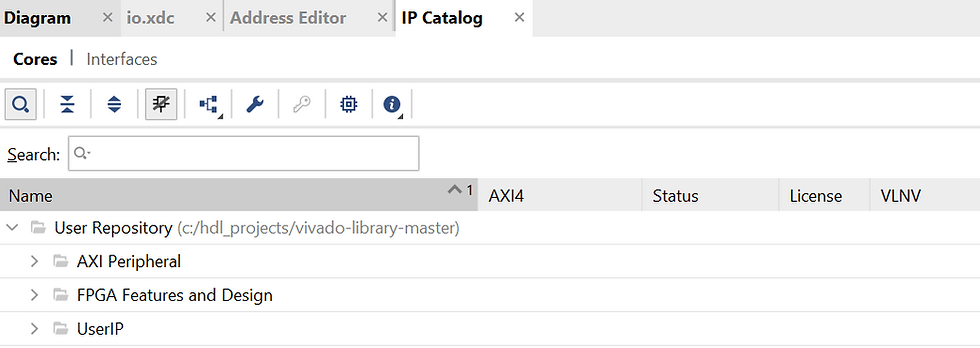
The Digilent Vivado IP library can be downloaded here. Once downloaded, we need to open the Vivado Library view and add the repository to the IP Catalog.

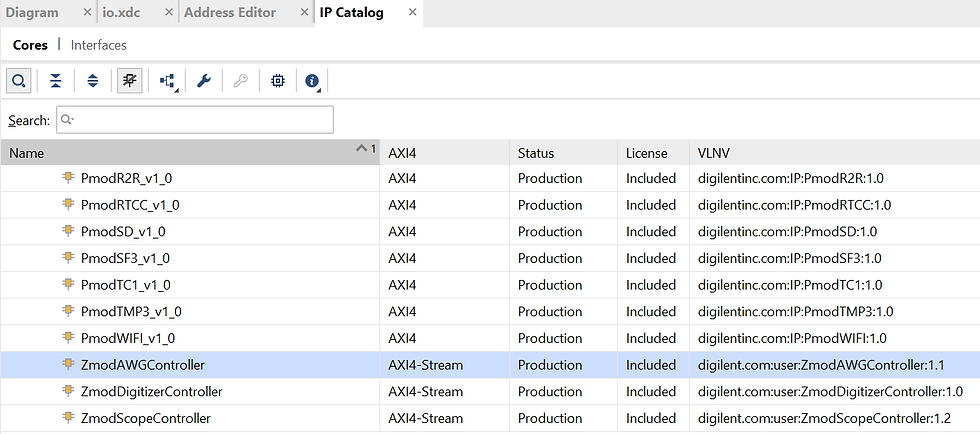
Once installed, you will see the Zmod AWG under the UserIP directory.

In the IP integrator block diagram, we need to implement the MPSoC processor configured for the ZU1CG board, along with adding a DMA and the Zmod AWG IP. The DMA will allow the transfer of waveform data to the Zmod IP for output.
The completed block diagram looks like the one below, with the Zmod IP and the AXI Interrupt IP. The clock buffer is provided to generate an output clock for the Zmod IP, which is 90 degrees out of phase with the AXI Stream input clock.

Once the design is ready for synthesis, we need to create the XDC pinout file. The pinout for high-speed IO is as follows:
SYZYGY Signal | FPGA Pin | Comment |
S0 | H2 | AWG1 |
S1 | N2 | D13 |
S2 | G2 | AWG2 |
S3 | P1 | D12 |
S4 | H4 | Reset |
S5 | N5 | D11 |
S6 | G4 | SCLK |
S7 | N4 | D10 |
S8 | J5 | SDIO |
S9 | M2 | D9 |
S10 | H5 | CS |
S11 | M1 | D8 |
S12 | G1 | EN |
S13 | M5 | D7 |
S14 | F1 | D2 |
S15 | M4 | D6 |
S16 | E4 | D4 |
S17 | L2 | D5 |
S18 | E3 | D1 |
S19 | L1 | D0 |
S20 | E1 | D3 |
C2P CLKIN | J3 | CLKIN |
P2C | L4 | CLKIO |
With the XDC created, we can implement the design and upload the HWH and Bit file to the ZU Board running PYNQ. If you are unsure how to get started with PYNQ on the ZU Board, read this blog.
To ensure I could capture the DAC waveform from the Zmod AWG, I have connected SMA to BNC cables, allowing me to connect the output directly to an oscilloscope.
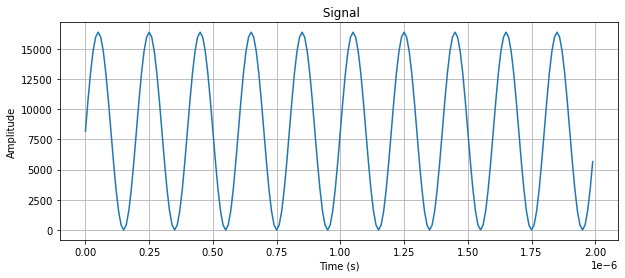
The Python script in Jupyter is very simple. First, we download the bit file and then follow this up by generating a simple sine waveform. As the DAC is 14 bits and ranges between 0 and VCC, we need to offset the signal we generate.
from pynq import Overlayol = Overlay('/home/xilinx/jupyter_notebooks/AWG/zu_AWG.bit')
import numpy as npimport matplotlib.pyplot as pltfrequency_pass = 5e6 sampling_rate = 100e6 # Sampling rate (100 MHz for better resolution)duration = 2e-6 # Duration in seconds (1 microsecond to show a few cycles)amplitude = 8192 # Maximum amplitude for signed 14-bit integert = np.arange(0, duration, 1/sampling_rate) # Time vectorsignal_pass = np.sin(2 * np.pi * frequency_pass * t) * amplitude # Sine wavesignal = signal_passsignal = signal_pass + amplitudeplt.figure(figsize=(10, 4))plt.plot(t, signal)plt.title(' Signal')plt.xlabel('Time (s)')plt.ylabel('Amplitude')plt.grid(True)plt.show()We can also plot this within the Jupyter notebook to view the waveform we are going to output.

To output this waveform, we need to do a couple of things. First, we need to format the work such that each 32-bit sample we send out over the DMA contains the data for DAC 1 and DAC 2. As these are 14-bit DAC, the lower 2 bits of the 16-bit element for each DAC channel is set to 0, followed by 14 data bits.

We can do this quickly using a for loop, which will create the merged data information for both channels.
dma = ol.axi_dma_0dma_send = ol.axi_dma_0.sendchannel
from pynq import allocate#create a buffer the same size of the signal of type int 16input_buffer = allocate(shape=(len(signal),), dtype=np.int32)#convert the signal to signed 16 bit representation int16_signal = signal.astype(np.int16)int32_signal = np.empty(len(signal), dtype=np.int32)
for i in range (0,len(int16_signal)): temp = int16_signal[i] temp = temp & 0xFFFF int32_signal[i] = (temp << 16) | tempOnce this is done, we need to copy the data from this buffer to a contiguously allocated memory buffer ready for transmission using the DMA.
#copy the signal into the pynq buffer np.copyto(input_buffer, int32_signal)#run the filter dma_send.transfer(input_buffer)Observing this using a scope will show the output waveforms, which correlate with the above plot in Jupyter.
Having run a simple waveform, we can generate a more complex waveform, for example, a chirp.
from scipy.signal import chirpfrequency_start = 1e6 # Start frequency of the chirp (1 MHz)frequency_end = 25e6 # End frequency of the chirp (5 MHz)sampling_rate = 100e6 # Sampling rate (100 MHz)duration = 2e-6 # Duration in seconds (2 microseconds)amplitude = 4092 # Maximum amplitude for signed 16-bit integer# Time vectort = np.arange(0, duration, 1/sampling_rate)# Generate sine chirp signalsignal_chirp = chirp(t, f0=frequency_start, f1=frequency_end, t1=duration, method='linear') * amplitudesignal_chirp = signal_chirp + amplitude# Plot the chirp signalplt.plot(t, signal_chirp)plt.title("Sine Chirp Signal")plt.xlabel("Time [s]")plt.ylabel("Amplitude")plt.grid(True)plt.show()
This can also be processed and formatted for transmission using the DMA as before.
Running this and observing on the oscilloscope will result in the more complex waveform being captured on the screen.

This project has shown it is very easy and simple to connect the Zmod to the ZU1CG board. In a future blog, I will examine how to connect one of the Zmod ADCs to the ZU1CG board, and maybe we can send and capture a signal from one to another!
Workshops and Webinars
If you enjoyed the blog why not take a look at the free webinars, workshops and training courses we have created over the years. Highlights include
Professional PYNQ Learn how to use PYNQ in your developments
Introduction to Vivado learn how to use AMD Vivado
Ultra96, MiniZed & ZU1 three day course looking at HW, SW and PetaLinux
Arty Z7-20 Class looking at HW, SW and PetaLinux
Mastering MicroBlaze learn how to create MicroBlaze solutions
HLS Hero Workshop learn how to create High Level Synthesis based solutions
Perfecting Petalinux learn how to create and work with PetaLinux OS
Embedded System Book
Do you want to know more about designing embedded systems from scratch? Check out our book on creating embedded systems. This book will walk you through all the stages of requirements, architecture, component selection, schematics, layout, and FPGA / software design. We designed and manufactured the board at the heart of the book! The schematics and layout are available in Altium here Learn more about the board (see previous blogs on Bring up, DDR validation, USB, Sensors) and view the schematics here.
Sponsored by AMD


