
MicroZed Chronicles: Vivado Simulator and Code Coverage.
- Jul 23, 2025
- 6 min read
When it comes to developing FPGAs it is often tempting to write our RTL and then try it, in the lab on the hardware to see how it works. However, this trial and error approach is not the most efficient and in your professional life we need to quickly learnt he skill of developing test benches and verification.
Verification uses a simulator and applies a number of test cases to the Design or Unit under test (DUT/UUT). In a well run FPGA development the tests applied demonstrate the DUT implements the requirements placed upon it.
Here the FPGA design has requirements placed on the module but the system engineers, the FPGA engineer has indicated compliance / non-compliance against the requirements, or better yet a technical feasibility score which identifies the technical risk. Against the requirements, a verification cross reference index (VCRI) is created which identifies for each requirement how it will be tested. For most FPGA requirements it will be simulation, but not always some many be by analysis e.g. power / thermal dissipation.
Knowing the requirements which must be verified in simulation, we are then free to start working on the test plans. Of course, what we want to do is find any issues, failures or corner cases within simulation as it is much easier and faster to correct them.
In a well controlled verification environment this will means a number of test cases are developed to test the DUT across a range of use, corner and boundary conditions.
Sadly however, it is easy to create a test case or suite of test cases which do not sufficiently exercise the DUT under test. Indeed we have looked at this topic before (link) however, with the 2025.1 release Vivado Simulator now supports code coverage for VHDL so I thought it would be worth re examining this capability.
Code Coverage allows us to understand how well our test cases exercise the DUT, to aid this several metrics are provided including.
Branch
Records if every possible outcome (branch) from a decision point (if, case, etc) has been taken at least once.
Branch coverage, helps identify issues in Else or Default cases, incorrect condition logic, flaws in state machines and of course dead branches.
    process (a_in, b_in, sel
    begin
        -- BRANCH POINT START: An 'if' statement creates a decision point.
        -- To achieve 100% branch coverage, both the 'true' and 'false'
        -- (or 'if' and 'else' in this case) must be executed.
        if sel = '0' then
            -- BRANCH PATH 1: This path is taken when 'sel' is '0'.
            -- To cover this path, you need a test case where sel = '0'.
            z_out <= a_in;
        else
            -- BRANCH PATH 2: This path is taken when 'sel' is not '0'
            -- To cover this path, you need a test case where sel = '1'.
            z_out <= b_in;
        end if;
        -- BRANCH POINT END
    end process;
Statement
Measures whether every executable line of code has been executed at least once during simulation.
Statement coverage enables us to ensure the test cases, identify any unused or unintended code in the design. It also helps identify any logic which is not stimulated by the test cases.
process (a_in, b_in, sel) -- STATEMENT 1: Process declaration. (Often not counted as executable by tools, but conceptually part of the flow)    begin
        -- STATEMENT 2: 'if' condition evaluation.
        if sel = '0' then
            -- STATEMENT 3: Assignment when 'sel' is '0'.
            z_out <= a_in;
        else
            -- STATEMENT 4: Assignment when 'sel' is '1'.
            z_out <= b_in;
        end if;
    end process;
In this example statement and branch appear to be similar and the stimulus would be similar. However, should the design not include the else statement, associated with the IF statement then a single statement test when the IF was true, to achieve branch coverage it would need to be both true and false.
Toggle
Monitors if every bit of every signal in a design has toggled state e.g. from '0' to '1' and from '1' to '0' at least once.
Toggle coverage is important as it enables identification of undriven or stuck signals, ensures input variation is provided e.g. if an input is not toggled then we have probably not generated sufficiently detailed stimulus.
entity my_mux is
    port (
        a_in    : in  std_logic; --Needs to toggle:'0'->'1' AND '1' -> '0'
        b_in    : in  std_logic; --Needs to toggle:'0'->'1' AND '1' -> '0'
        sel     : in  std_logic; --Needs to toggle:'0'->'1' AND '1' -> '0'
        z_out   : out std_logic  --Needs to toggle:'0'-> 1' AND '1' -> '0'
    );
end entity my_mux;
Condition
Records if every boolean sub-expression within a condition has evaluated to both TRUE and FALSE at least once.
Conditional coverage differs from branch coverage in that branch coverage counts if the branch conditions evaluate to true and false at least once each. Conditional coverage, records the coverage of the conditions / sub conditions in the branch. This helps to identify flaws in combinatorial logic by providing a more granular debugging capability.
process (enable_A, enable_B, mode_sel)
    begin
        -- This is the main condition for Condition Coverage
        -- The overall expression is (enable_A and enable_B) or mode_sel
        if (enable_A = '1' and enable_B = '1') or (mode_sel = '1') then
            -- This executes if the overall condition is TRUE
            output_data <= '1';
        else
            -- This executes if the overall condition is FALSE
            output_data <= '0';
        end if;
    end process;
A summary of the conditions and differences between conditions coverage types can be compiled.

Lets take a look with a simple counter design how we can get a design up and running and a test case created to stimulate the design.
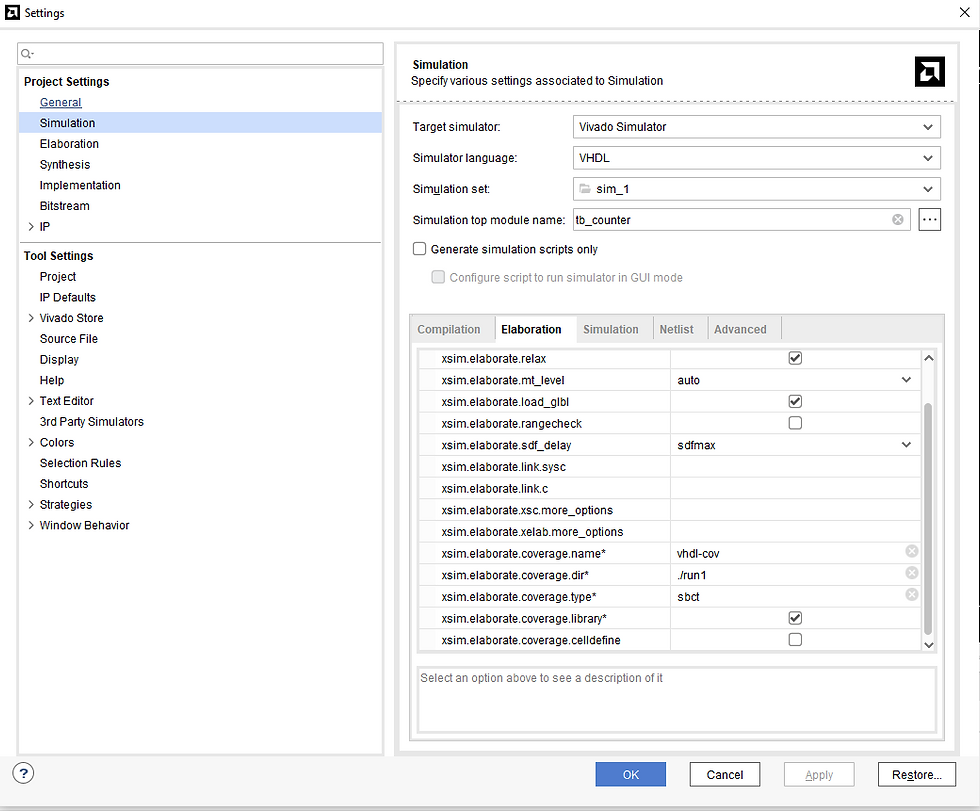
To configure for code coverage we need to set the simulation properties to include a coverage name, define the coverage directory and the type of coverage.
We can then run the simulation, ensuring its functional correctness.

Once the simulation is completed, we need to convert the data base into a report using the following commands.
The first saves the code coverage reports to the database.
write_xsim_coverage -cov_db_dir run1 -cov_db_name vhdl-covWhile the second converts the updated database into a HTML Report.
export_xsim_coverage -cov_db_name vhdl-cov -cov_db_dir run1 -output_dir cReport1 -open_html trueThis will show the results in a HTML browser.

We can then explore each modules particular code coverage performance, remember we are aiming to get code coverage on the UUT not the test bench stimulus file.
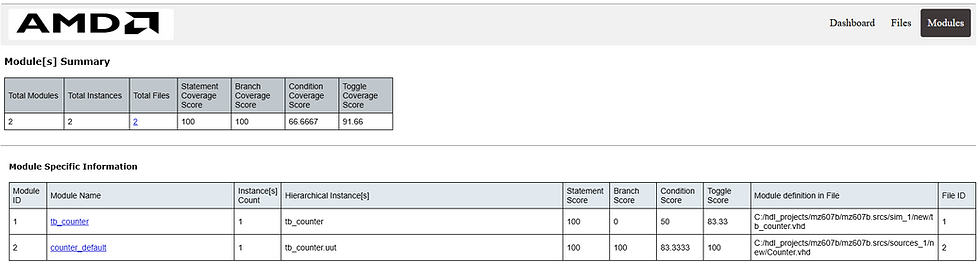
Looking at the counter example report we can then check on the coverage type, this will open the code and show colour coded (green/red) the lines stimulated by the test bench and those not. It will also provide a count of the execution type.

As you can see from the report we hit 100% of the metrics for statement, branch and toggle at the module level but failed to achieve 100% for condition.
Selecting the condition coverage to be shown, the report will show the conditions not covered in red. We can clearly see here the rising edge is not tested for a false condition.

Of course, there are some exceptions which cannot be included in code coverage metrics, due to an inability to enter the condition in normal use. These conditions will vary from solution to solution. Justification should be noted for each exception entered, within Vivado exceptions can be entered using a exclusion file.
In summary, code coverage is a great capability for a simulator to provide, I am happy to see Vivado extend this capability to VHDL.
UK FPGA Conference
FPGA Horizons - October 7th 2025 - THE FPGA Conference, find out more here.
Workshops and Webinars:
If you enjoyed the blog why not take a look at the free webinars, workshops and training courses we have created over the years. Highlights include:
Upcoming Webinars Timing, RTL Creation, FPGA Math and Mixed Signal
Professional PYNQ Learn how to use PYNQ in your developments
Introduction to Vivado learn how to use AMD Vivado
Ultra96, MiniZed & ZU1 three day course looking at HW, SW and PetaLinux
Arty Z7-20 Class looking at HW, SW and PetaLinux
Mastering MicroBlaze learn how to create MicroBlaze solutions
HLS Hero Workshop learn how to create High Level Synthesis based solutions
Perfecting Petalinux learn how to create and work with PetaLinux OS
Boards
Get an Adiuvo development board:
Adiuvo Embedded System Development board - Embedded System Development Board
Adiuvo Embedded System Tile - Low Risk way to add a FPGA to your design.
SpaceWire CODEC - SpaceWire CODEC, digital download, AXIS Interfaces
SpaceWire RMAP Initiator - SpaceWire RMAP Initiator, digital download, AXIS & AXI4 Interfaces
SpaceWire RMAP Target - SpaceWire Target, digital download, AXI4 and AXIS Interfaces
Embedded System Book
Do you want to know more about designing embedded systems from scratch? Check out our book on creating embedded systems. This book will walk you through all the stages of requirements, architecture, component selection, schematics, layout, and FPGA / software design. We designed and manufactured the board at the heart of the book! The schematics and layout are available in Altium here. Learn more about the board (see previous blogs on Bring up, DDR validation, USB, Sensors) and view the schematics here.
Sponsored by AMD


