
MicroZed Chronicles: SW Development with Vitis and Visual Studio Code
- Feb 22, 2023
- 4 min read
Updated: Jun 25, 2025
A lot of my FPGA development takes place within Visual Studio Code where I use it with TerosHDL to create HDL and cocotb for verification. One of the things that’s been on my list for a while is to integrate software development for MicroBlaze and Arm processor cores in our AMD devices.

Using VS Code is straightforward though it is a little more involved with Vitis command line tools versus if we were to use the Eclipse IDE.
Here is the basic flow for this development.
Create the hardware design in Vivado and export the XSA.
Create the workspace directory where the software elements will be built.
Create a make file which uses XSCT to create the platform and template application.
Create VS Code tasks to build and clean the executable this uses the make files generated by XSCT.
Obtain the processing system and programmable logic initialization script from Vitis.
Create a debug initialization TCL script.
Create a VS Code task to run the debug initialization script.
Create a VS Code run configuration to debug the application.
This example was developed on an Ubuntu 18.04 LTS desktop with Vitis installed. The first step of the development was to create a simple ZCU106 hardware design. I instantiated the processing system only for this application.

Once the bitstream was enabled, I exported the XSA with the bitstream included.
The next step to develop the software is to open a terminal window and source the Vitis initialization script. This script resides in the Vitis installation directory.

The next step is to open VS Code from the same terminal. This ensures VS Code is aware of the location of the Vitis tool elements including XSCT and XSDB.
Once VS Code is open, we are going to create a make file which will call XSCT to create the platform. This script can be generic and use variables set in a terminal to define platform, project system names etc.
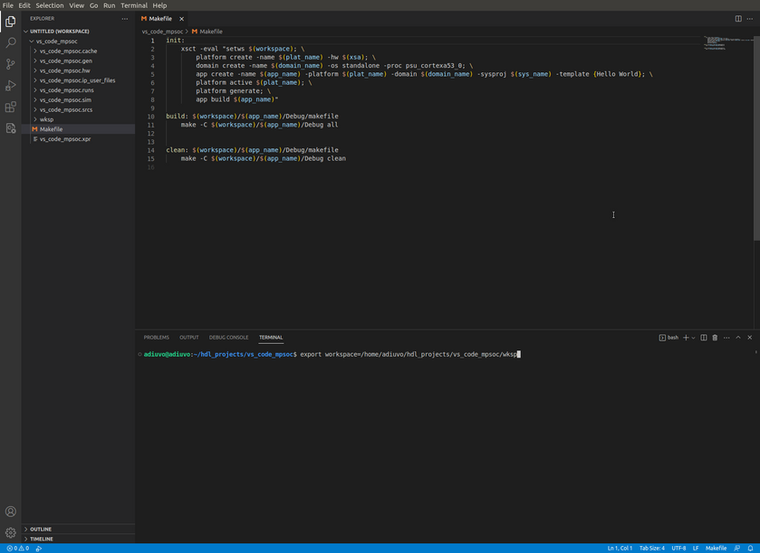
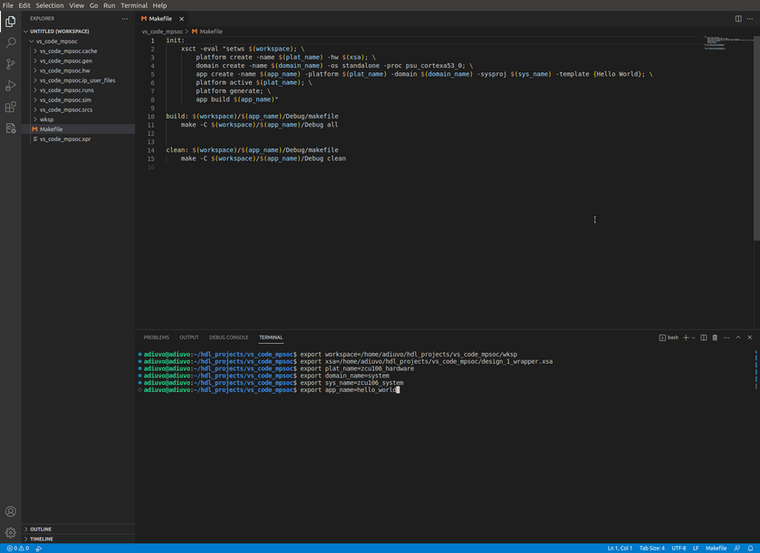
Enter the following variables in a terminal window in VS Code:
workspace - The name and location of your workspace directory. Mine is called wksp for this application.
xsa – the path and name of the exported XSA
plat_name – the name of the platform
domain_name – the name of the domain
sys_name – the name of the system project
app_name – the name of the application


We can create a make file and enter the following code. When called make init from the VS Code terminal window, this will create a new project based on the XSA along with the platform, BSP, and application project.

Once this has completed, you will see several new directories under the workspace.
We can now add commands to the make file to build and clean the elf files for the example application. To do this, we will use the make files created by XSCT during the init process. The make file reside under the workspace and application directory just created.
<insert make file>
We can create VS Code tasks to run the build and clean options in the make file. To do this from the terminal menu, we can create a new task and then select from template.

We can add in elements to the example JSON file to build and clean the application by calling the make files.

You can try these commands from the terminal menu. You should see the elf file deleted when cleaned and created when built. We can also extend this to the init function as well.
This proves we can build an application within VS Code, however, we also want to be able to debug the application we have just created. To do this for each project where we want to use VS Code, we need to open Vitis IDE and obtain the initialization sequence when doing gdb debugging.
To open the Vitis IDE from the VS Code terminal enter the following:
vitis -workspace $workspace
This will open the Vitis IDE and show the platform and system project we created during the initialization sequence.

To get the initialization script, make sure the board is connected to the development machine. Then select Debug, Launch Hardware (Single Application Debug (GDB) from the assistant menu. This will launch the application and download it to the target board.
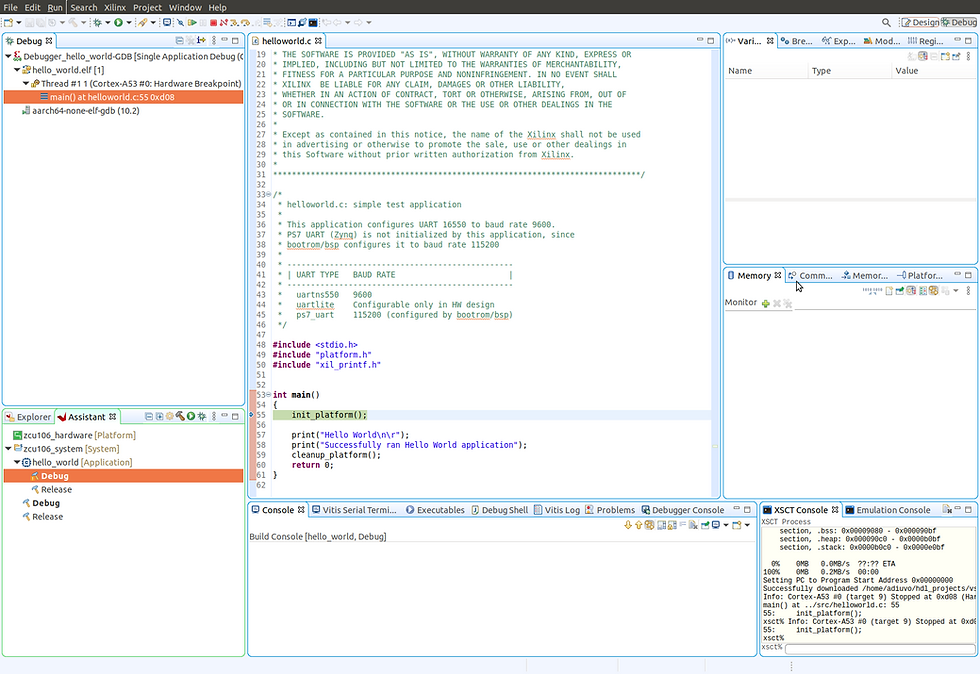
From the Vitis log, we want to copy the information between the ----XSDB Script and --- End of Script

Copy this into a TCL script called dbg_init_a53.tcl within your VS Code project. I put mine at the top level. We can close Vitis once this is done.

To be able to debug from within VS Code, ensure you have the Native Debug extension installed.
We need to create a new run configuration for the GBD from the run terminal. Select Add Configuration from the run tab first and then Debug External Embedded Device when prompted.

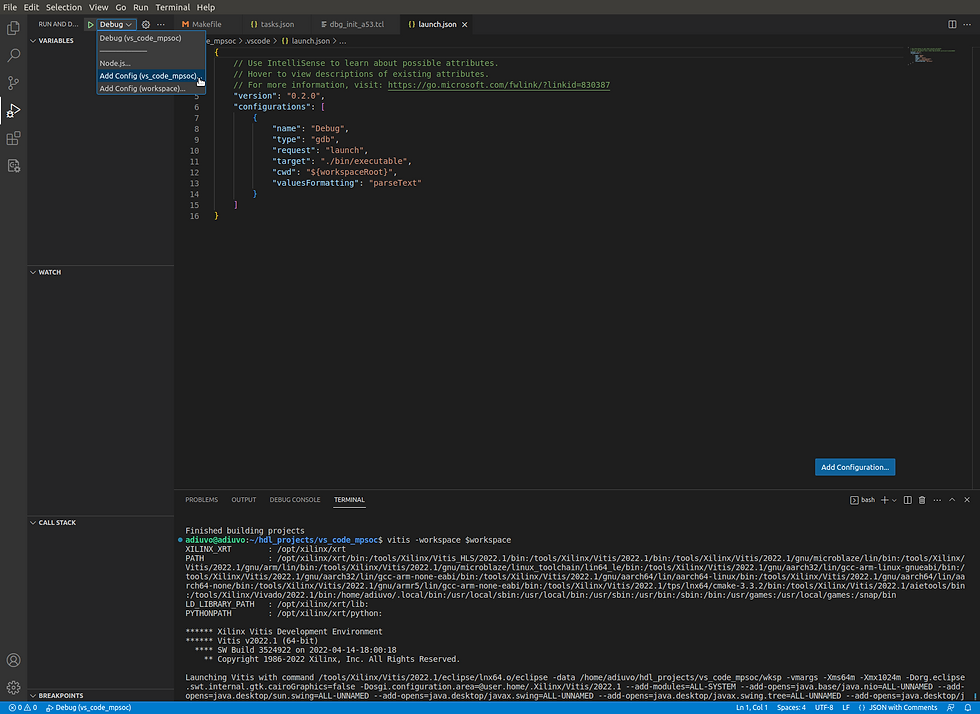

Update the launch.json to include the information below.

Finally, we need to create a new task to start the debugger using the initialization script. Add the following calling TCL script to the tasks.json file.

With the hardware connected, open the hello world source file and introduce a break point in the code. From the terminal menu, run the GDB init script. Then select the debug configuration just created from the run menu and you will see the code download and stop at the breakpoint.

We can now develop the application for the base hardware using VS Code. Happy developing!
Workshops and Webinars
Enjoy the blog why not take a look at the free webinars, workshops and training courses we have created over the years. Highlights include
Ultra96, MiniZed & ZU1 three day course looking at HW, SW and Petalinux
Arty Z7-20 Class looking at HW, SW and Petalinux
Mastering MicroBlaze learn how to create MicroBlaze solutions
HLS Hero Workshop learn how to create High Level Synthesis based solutions
Embedded System Book
Do you want to know more about designing embedded systems from scratch? Check out our book on creating embedded systems. This book will walk you through all the stages of requirements, architecture, component selection, schematics, layout, and FPGA / software design.
We designed and manufactured the board at the heart of the book! The schematics and layout are available in Altium here
Learn more about the board (see previous blogs on Bring up, DDR validation, USB, Sensors) and view the schematics here.
Sponsored by AMD Xilinx


